Before we start debugging, we have to configure a few options so that PHPEclipse and XDebug know where to find various components.
To begin, we must specify the PHP Interpreter Path. This may differ depending on your system. For Windows based systems, this is a path to a file called php.exe. For Linux systems, this is a path to a file simply called php. For Linux systems, this is often in /usr/bin/php. To specify the PHP Interpreter, select Preferences from the Window drop down menu. Open up the PHPEclipse selection and click on XDebug. In the settings pane on the right that appears, enter your debug port and the path to your PHP interpreter. The default debug port for XDebug is 9000, but your system may be setup differently. To verify that 9000 is the correct port, find a way to access your phpinfo() page and check the value of xdebug.remote_port. The value of xdebug.remote_port should match the debug port value.
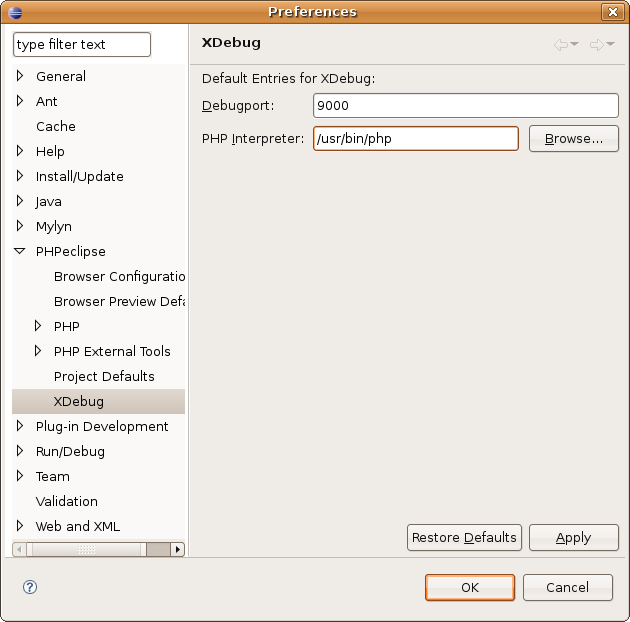
When you have entered the appropriate values, click on the OK
button.
Now that we have configured XDebug, we need to create a debug configuration. This will tell Eclipse how to start the debugger for your project. To do this, select 'Open Debug Dialog' from the Run drop down menu. You will be presented with a list of items which you can debug. Double click on the entry titled 'PHP XDebug Script'. This will create a new configuration and allow you to specify the necessary options. You can provide a name for your debug configuration, and then you must specify the filename which should be executed for debugging purposes. In this case, the filename is index.php.
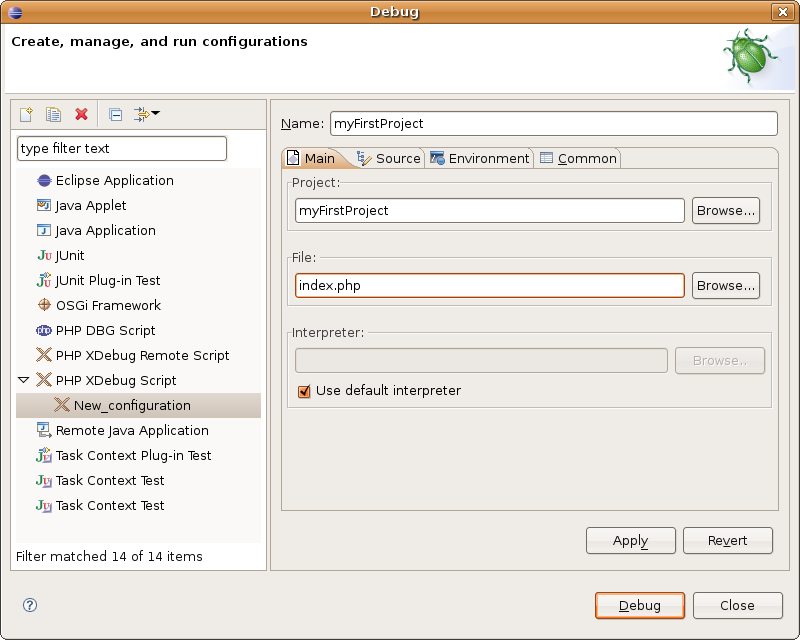
When you have selected the appropriate file, click on the
Debug button to start debugging. After the program has finished, you
should see the Console window at the bottom of your screen. It will tell
you the status of your script (terminated in this case), and the output
below it (Loop0 Loop0 Loop1 Loop0 Loop1 Loop2 Loop0 Loop1 Loop2 Loop3
Loop0 Loop1). You have now successfully created a debug configuration
and are ready to use the debug tools to analyze your scripts.