Simply being apply to execute our script and view the output isn't too helpful - we can do that from the command line, or via the web browser. The real power in debugging comes from the ability to set breakpoints and step through scripts. A breakpoint is just that - a point in your script at which you would like to break. What will happen is that the PHP Interpreter will continue as normal until it reaches the specified line in your program. When it reaches that line, it will stop and wait for your instructions as to how to proceed.
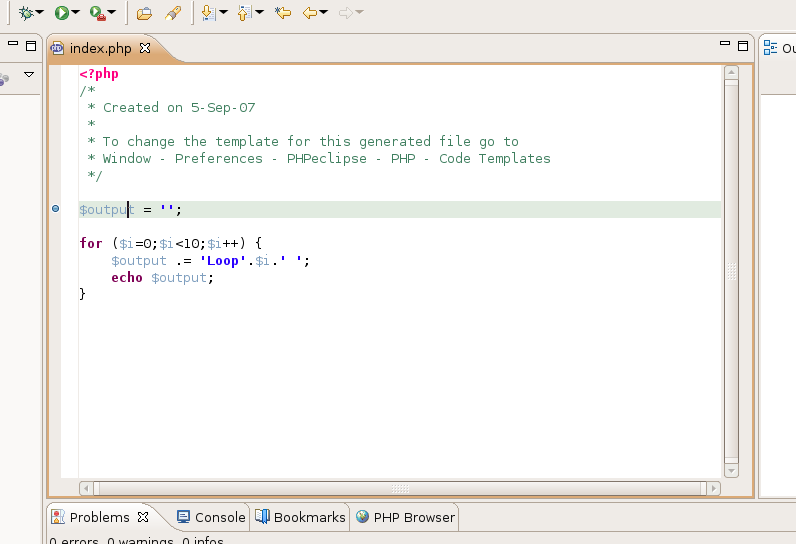
To set a breakpoint, move the mouse over the gray bar at the far left of the margin. Right click beside the line at which you want to break, and select the option 'Toggle Breakpoint'. Ensure you select 'Toggle Breakpoint' and not 'Toggle PHP Breakpoint' - the latter will not work. After you toggle the breakpoint, a blue ball should appear in the gray margin beside the line you specified.
After you have added your breakpoint, select Debug
History-myFirstProject (or whatever name you gave your configuration) from
the Run menu.
Now, to view our debug information, we need to change to our Debug Perspective. To do this, select the Window drop down menu and select Open Perspective-Debug.
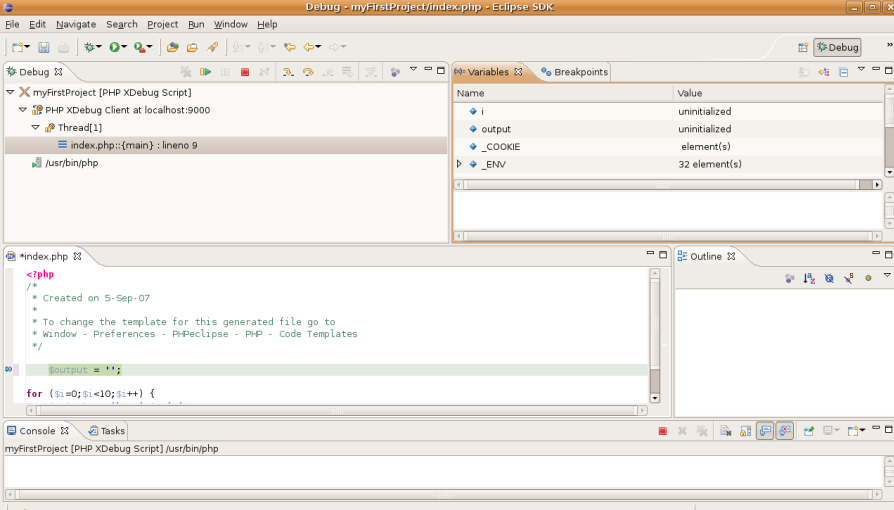
There are a number of things you will notice on the Debug perspective. The top left has a list of scripts that are currently running. There are button in this pane that can control the execution of the script. The first button labelled in the diagram is the Resume button. Clicking on this button will cause execution of your script to resume until it reaches the next breakpoint. The second button that is labelled is the Terminate button. This button will cause execution of your script to terminate. The third button and fourth buttons are the Step Into and Step Over buttons. These will both cause one line of your script to run. The difference between the two is that the Step Into button will expand any function calls on the line, and the step over button will treat function calls as one line. So, if you are not worried about the functions that are being called on a given line, you should use Step Over. If you want to see exactly what the functions are doing, you should use Step Into.
To the right of the Debug pane you will see a pane with a Variables tab and a Breakpoints tab. In the variables tab, you will see a list of variables that are in the current scope. Our script uses two variables - $i and $output. You will notice that a number of environment variables are also listed. Along with the list of variables, you can see the values of those variables. This is useful if you want to track what happens to a variable over the course of execution of your script. Clicking on the Breakpoints tab will allow you to see a list of breakpoints that have been set for your script. From this tab, you can turn breakpoints on and off by checking or unchecking the checkboxes that are beside them. There are also buttons to remove selected breakpoints and to remove all breakpoints for your script.
Underneath, you will see an editor containing the current source file that is being executed. A blue arrow generally follows execution of your script. At the very bottom is a window that displays the Console where you can see the output of your script.